Visualizing Heat Island Effect on the urban context with thermal imagery
The Heat Island Effect has become one of the things that contribute to Global Warming. The increase in urban areas and the reduction of forests and grasslands have an impact on increasing the temperature of our cities. Also, the machinery from building services and vehicles that move along the cities, has an impact on increasing them within the urban environments. This creates raises during the day hours but also this is perceived, even at night time. The absorbed heat also gets released after solar radiation ceases, after sunset, making it hard to achieve good outdoor thermal comfort over the hottest weeks of the year. This has an impact on the energy consumption related to Air Conditioning so we are more prone to increase our carbon footprint in the summertime if more heatwaves reach our cities.

London Heatwave in July 2022
Our thermal experts at WDS-LAB grabbed the thermal camera and jump to the streets on 19th of July in the middle of the Heatwave that hit London raising its temperatures to 39 degrees celsius. An unprecedented record that this country had never experienced before making this the hottest day in UK history. This is clear evidence of Global Warming and we wanted to document it and study how it affected different areas with and without vegetation in different points of zone two.
The soothing effect of vegetation in the built environment.
The images below show a series of images of areas with and without vegetation. In the Borough of Haringey. The thermal images show the surface temperatures, and as we can see these were unusually high for a typical sunny day in London. The pictures were taken when the Air temperature picked to its highest point, 39C. on that day that it happened around 16.00h. All the images were taken between 16.00 and 17.00 that day. From the study, we can see that the vegetation had a great impact on reducing the average values, registered in the thermal photos. the team at WDS used advanced algorithms to measure accurate values from each shot, and adjusted the temperature bounds to be sure each image can be compared with another one with the same threshold. The streets with vegetation normally display darker colours due to the lower temperatures, while the commercial high streets and roads with less vegetation showed more areas in red, with higher temperatures.
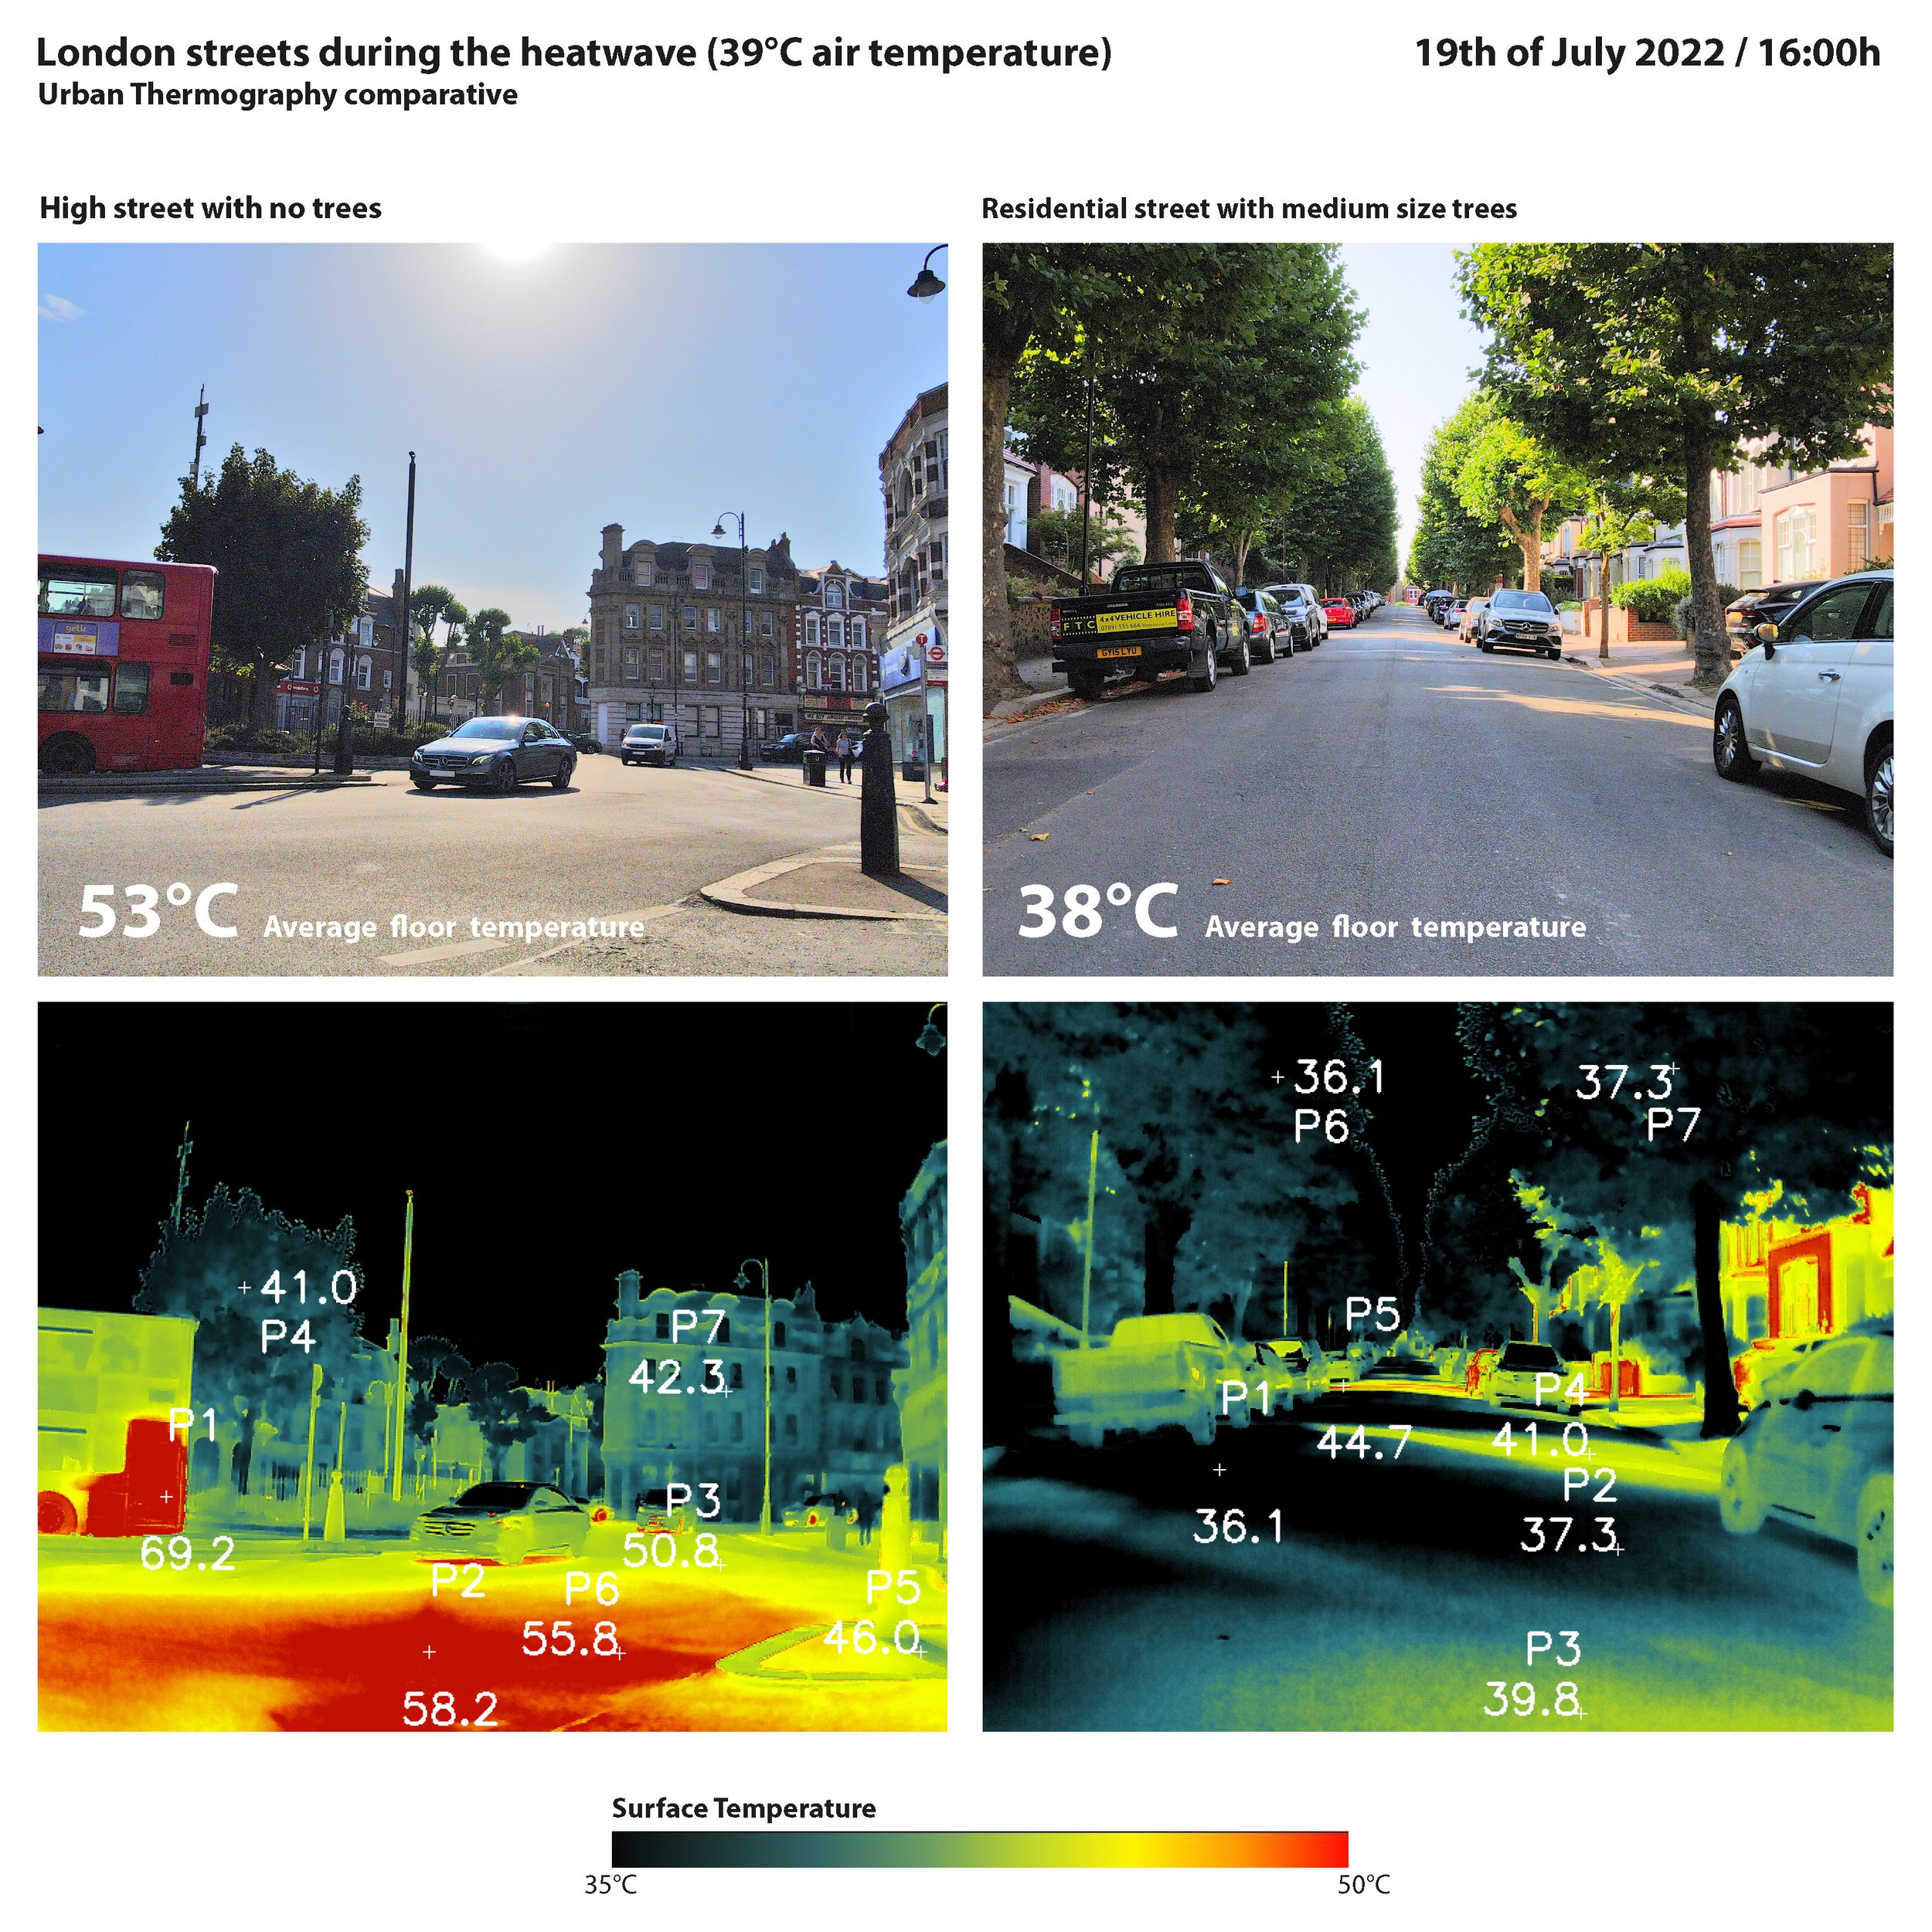

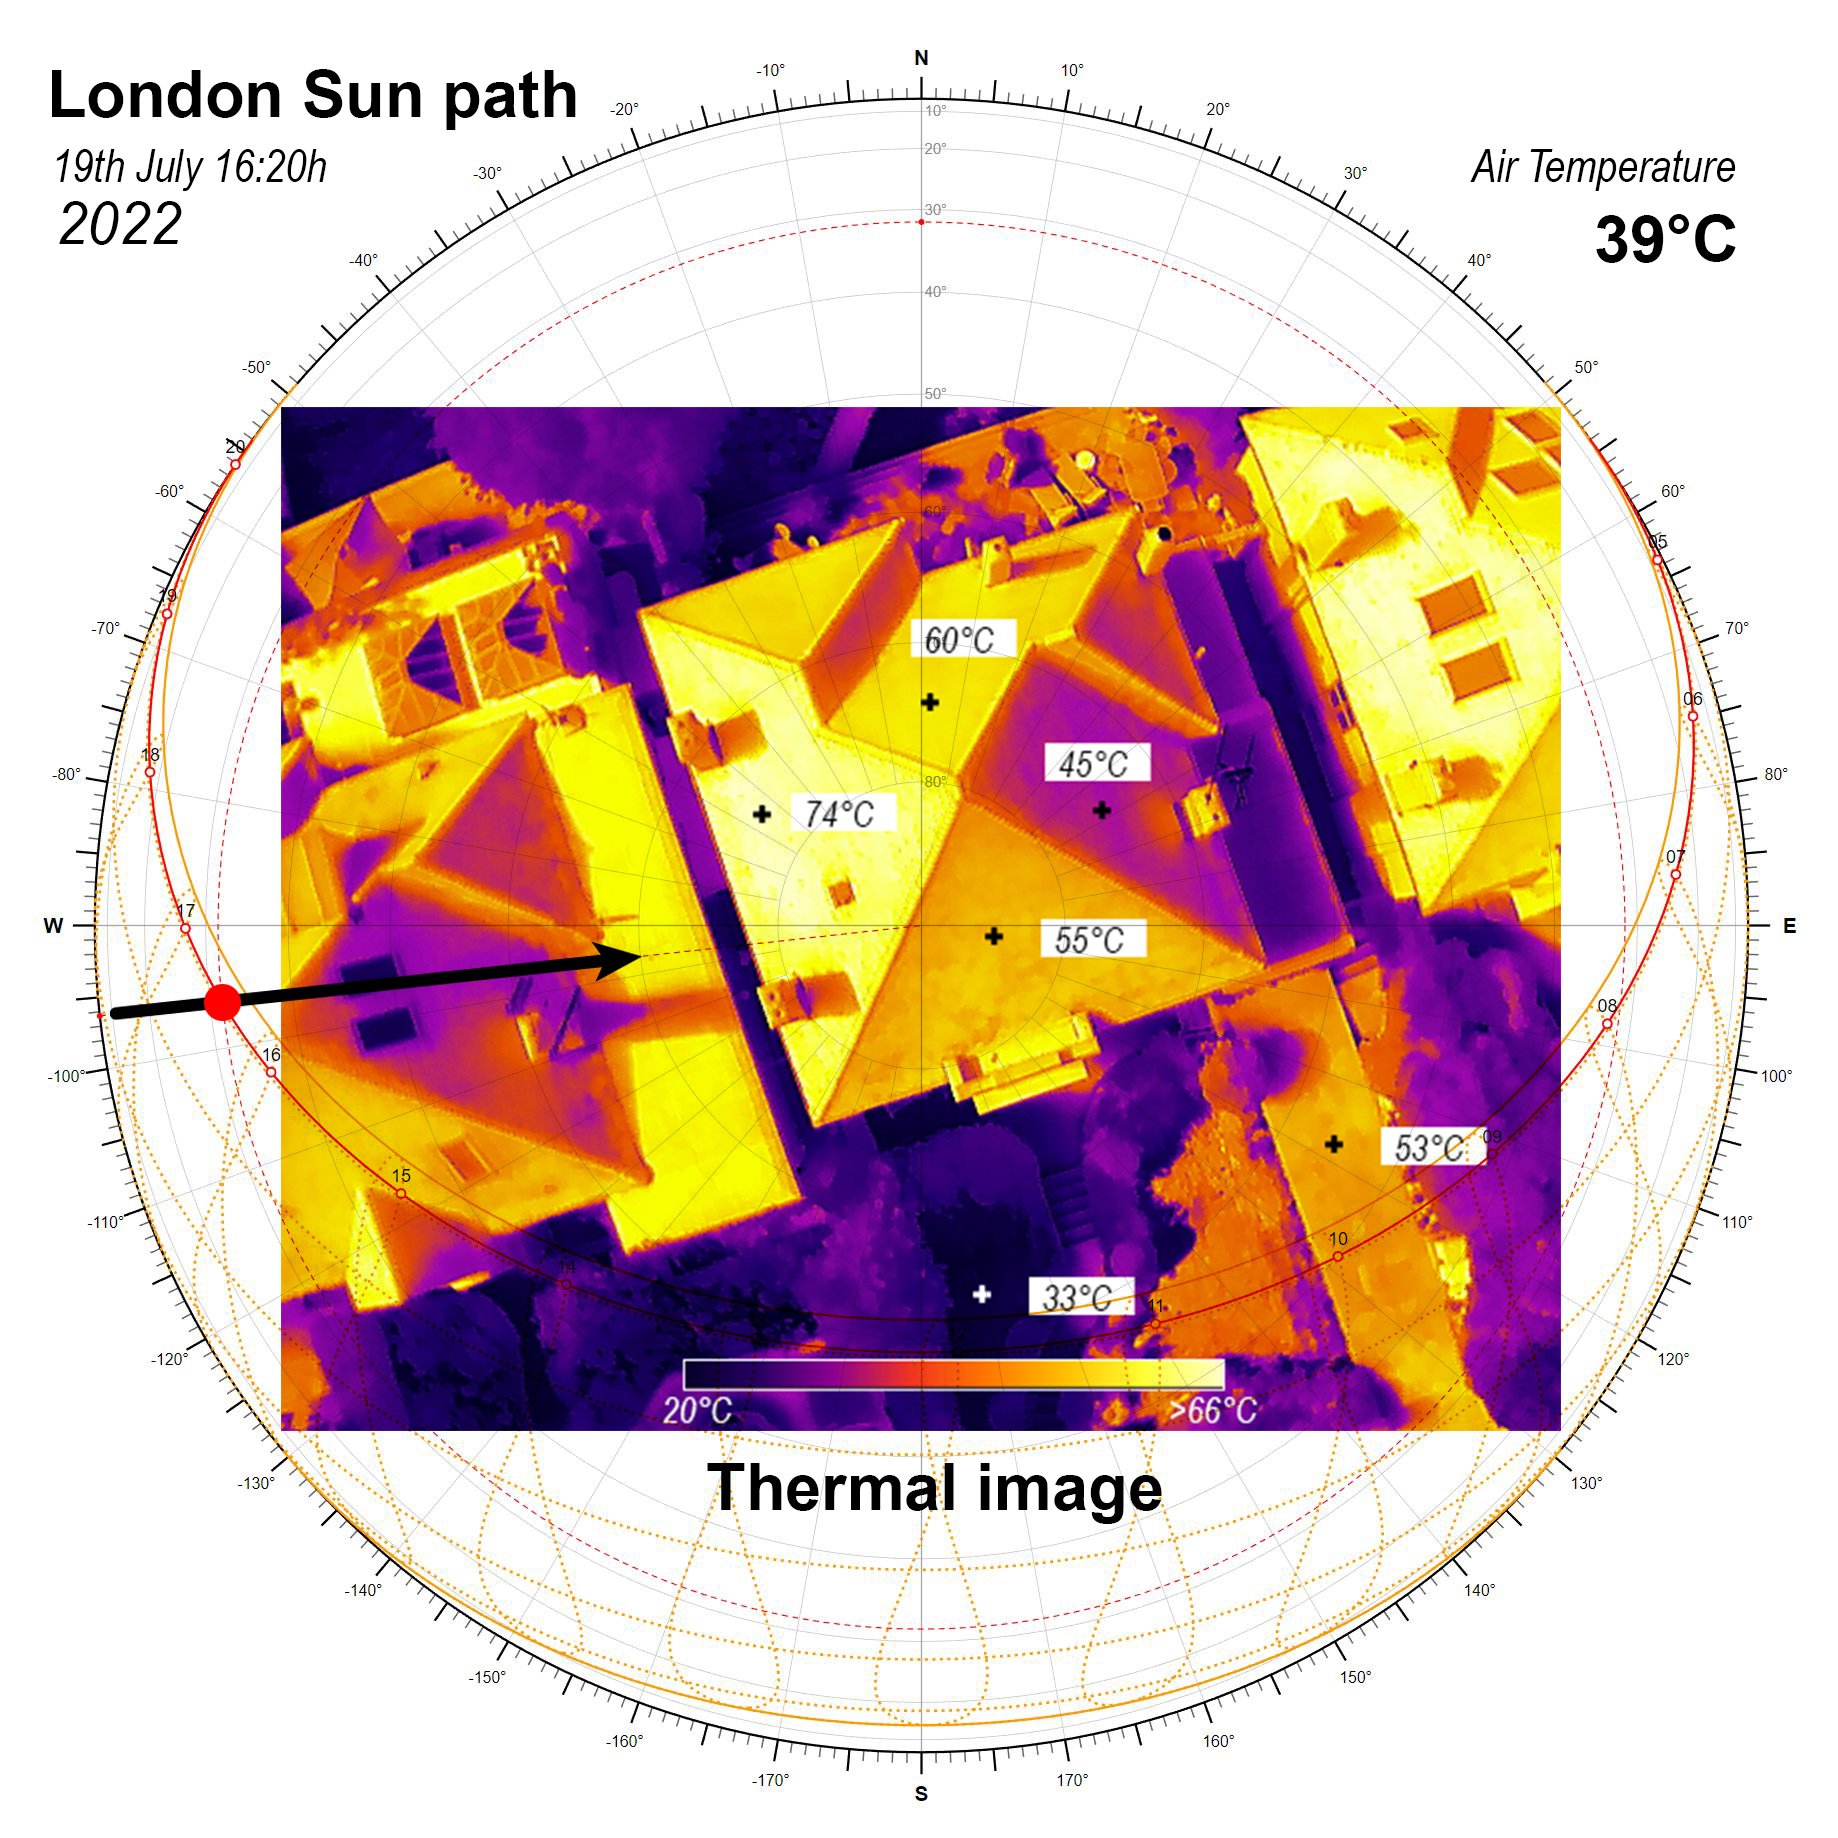
Thermal images store temperature information in each pixel, so we can check the temperatures by looking at the picture, without the need of even touching the surfaces. Thermal cameras have proven to be an efficient system for evaluating anomlaies in industries, constructions or equipment. Architects and urban surveyors can use it to detect thermal bridges or unusual temperature rises, in building services. In this case, the WDS-LAB team worked with these images to measure temperatures on roads, roofs and vegetation to evaluate the effect of the heatwave in London. The results show how different materials and locations behave under the same atmospheric conditions. As you can see in the images below, in some cases inclined roofs surfaces that get more perpendicular to the sun radiation reach temperatures over 74°C

Using Thermal drones to generate Thermal Orthomosaics
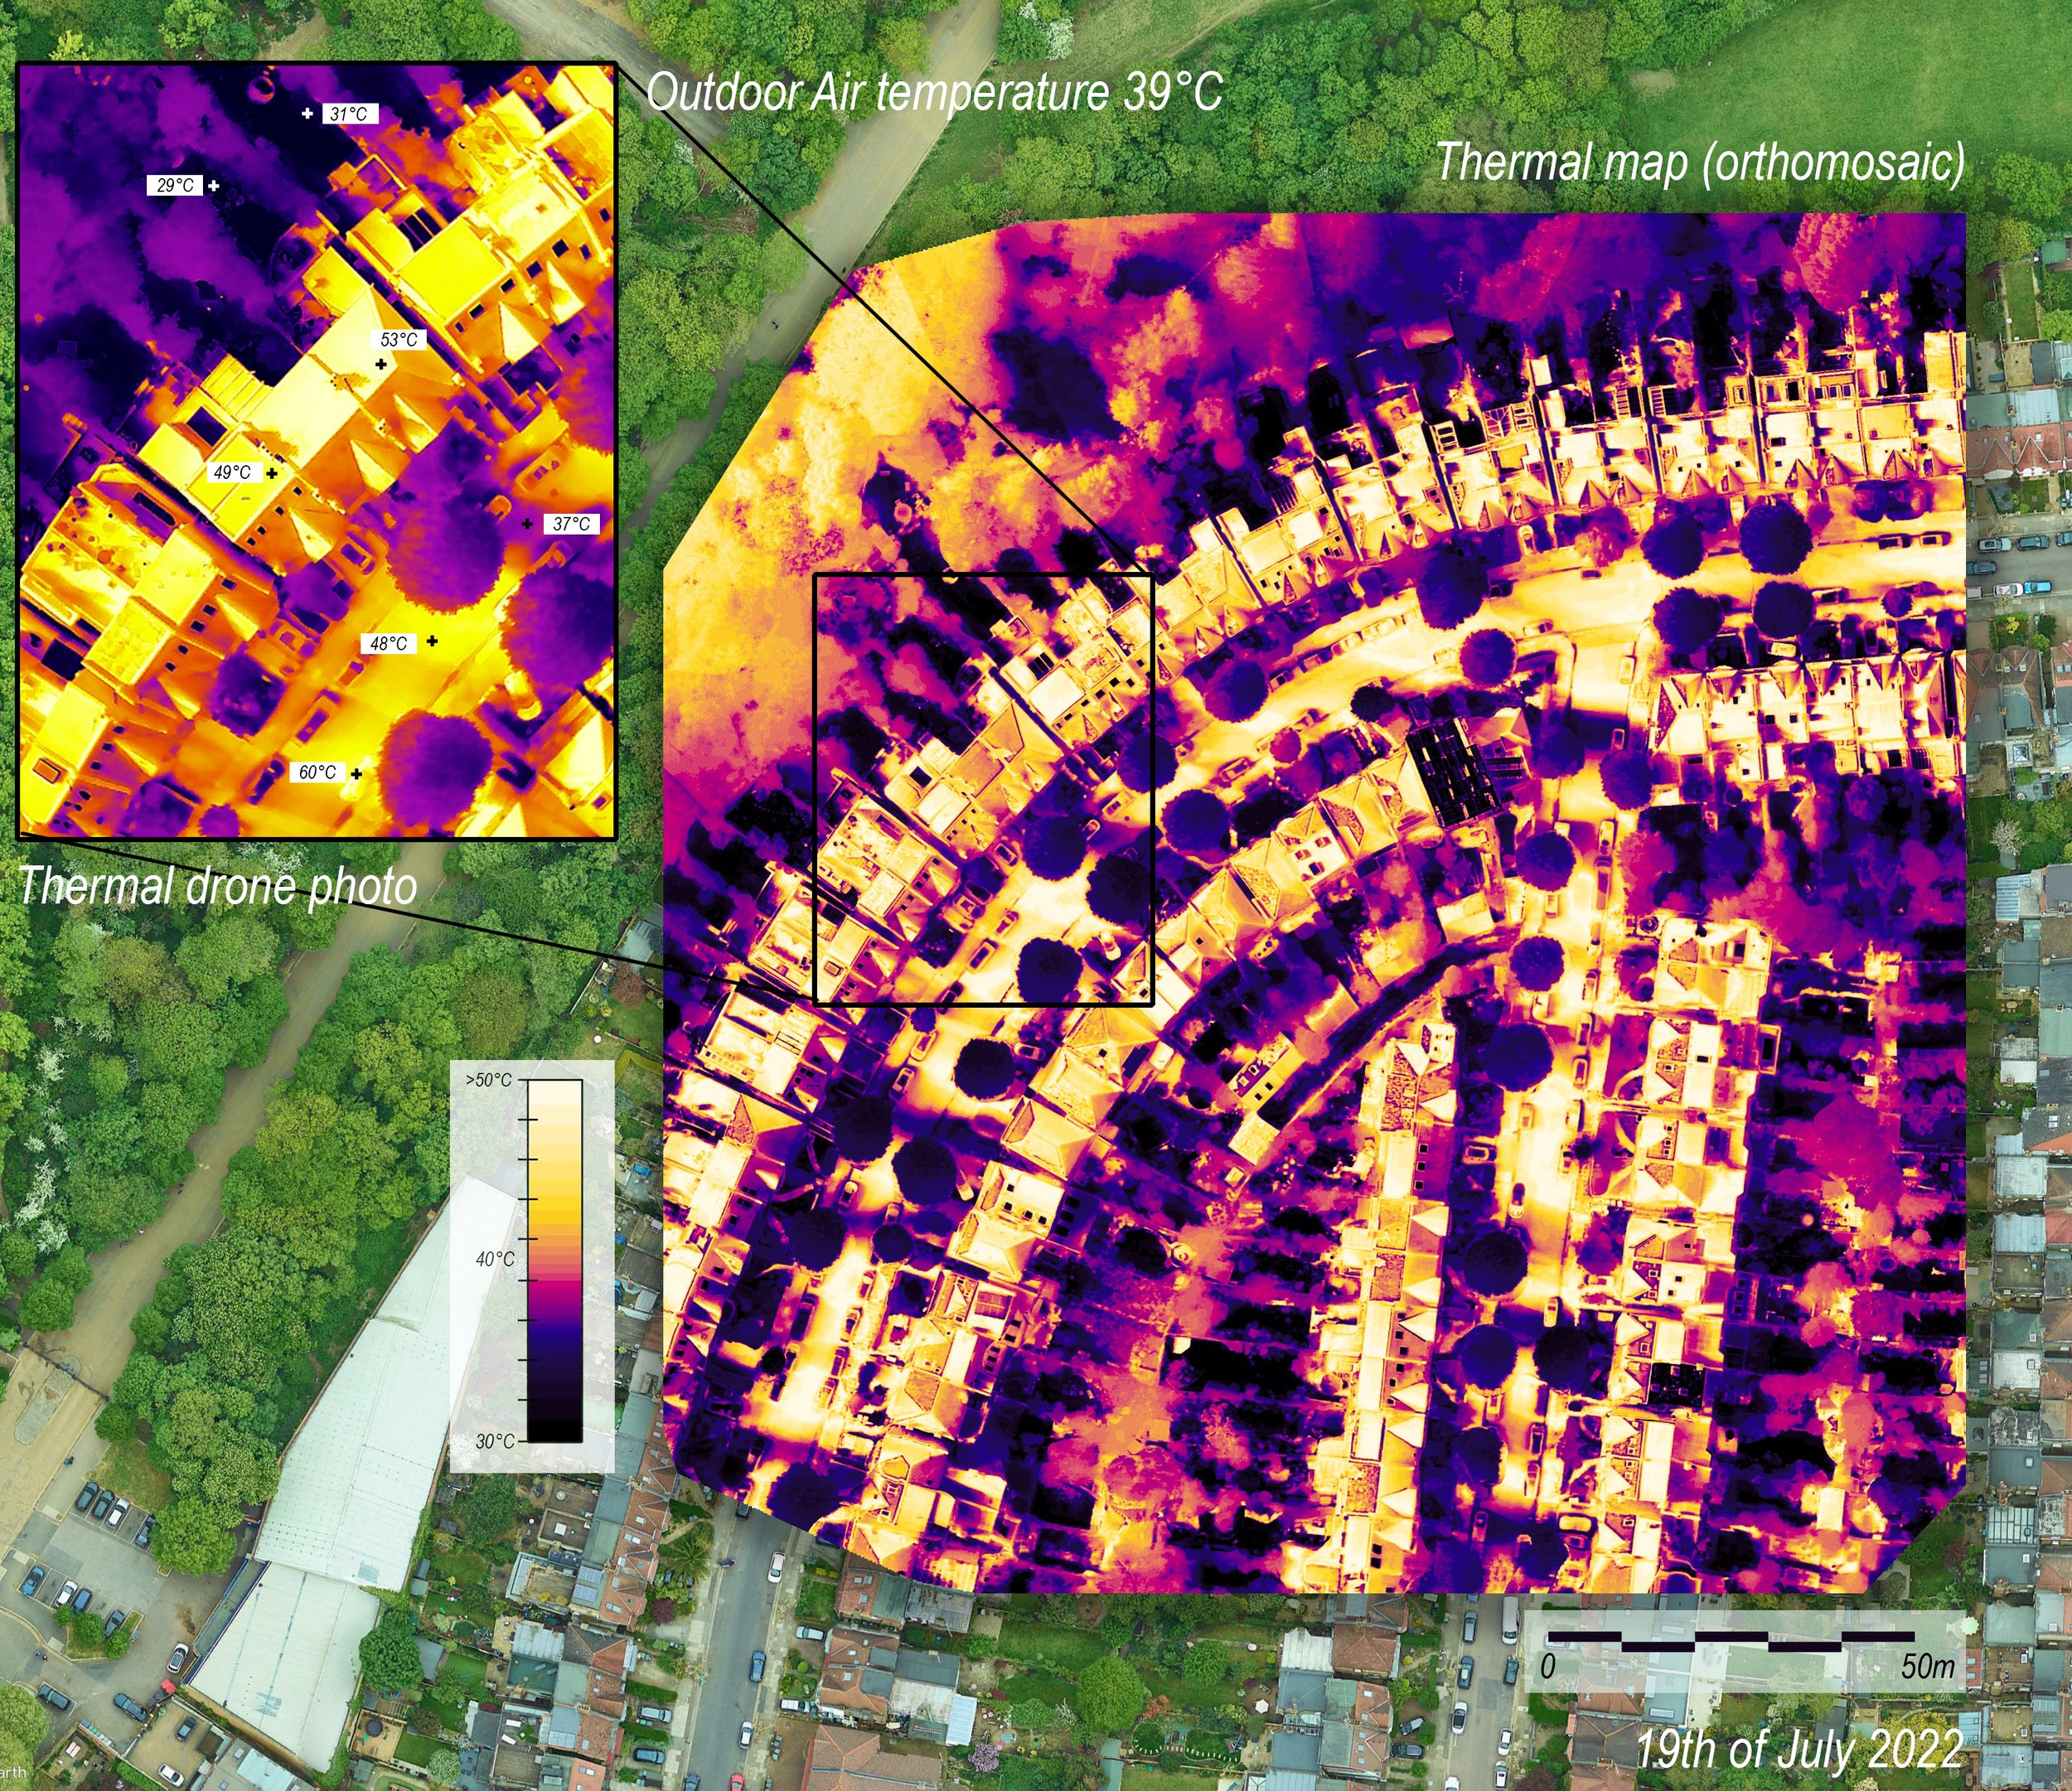
The WDS team also registered the data from the air by sampling a small residential area, to evaluate better the behaviour of the streets under such an unusual weather pattern. In order to gather the data a small foldable drone equipped with a thermal camera was used to capture thermal images only, flight time was less than 6 minutes and around 200 pictures were taken. Using later Pix4D, and special software dedicated to drone image processes and remote sensing, it was possible to stitch the images together and generate a high-resolution thermal map perfectly geolocated.
Thermal Orthomosaic results
The image below shows the thermal map results on the sampled residential area, as you can see the image was taken in the afternoon being the southwest surfaces that receive higher temperatures. Most of the vegetation trees and high vegetation remain colder than any other hard surfaces. The roads that are shaded are depicted with darker colours, which reduced the heat island effect. Mor improvement would be seen if the roofs of the residential areas could be covered with vegetated surfaces.